Clojure 1.9 startup
I received some feedback after my post on JVM tricks to help Clojure start faster that people were curious about relative performance of Clojure 1.9. I won’t go over how to enable CDS, AppCDS and AOT in this post - see the previous post for that stuff - this is just a summary of the results of testing 1.9.
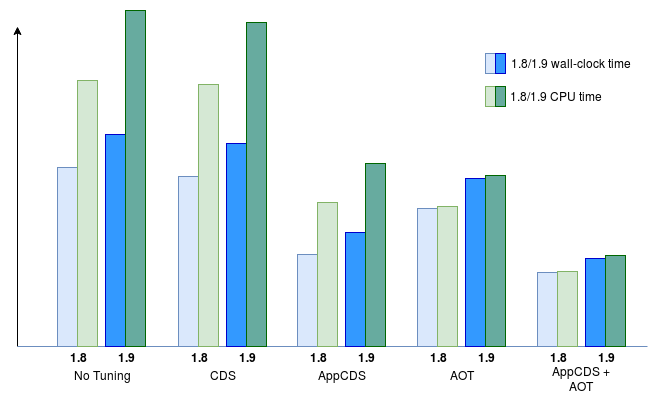
Here’s what I found. Y-axis is time taken (normalised, so no units), so smaller is better:
Headline results

- In all cases Clojure 1.9 startup is around 20% slower than 1.8
- AppCDS really really helps speed it up, and it’s easy to do
- AOT reduces CPU time more than wallclock time - helpful if you’re running a lot of JVMs, for sure
- Obviously, the next question is why is 1.9 slower?
Details below
Methodology
JVM
⇒ /home/mjg/tools/java/bin/java -version
java version "9"
Java(TM) SE Runtime Environment (build 9+181)
Java HotSpot(TM) 64-Bit Server VM (build 9+181, mixed mode)
perf
⇒ sudo perf -r50 -e cpu-clock $CMD
Clojure 1.8
Invoked with:
java -cp clojure-1.8.0.jar clojure.main -e ',,, program ,,,'
Clojure 1.9
Installed as per the “Installation on Linux” instructions from the 1.9 CLI Guide.
NB1: For some reason, this gets beta1 not beta2 but I assume that performance differences are not significant.
NB2: You can use the clojure script as I did in the first few examples, but to fiddle with the JVM I found it easier to use:
java -cp $CLJ_SCRIPTS/libexec/clojure-scripts-1.9.0-beta1.229.jar clojure.main -e ',,, program ,,,'
BTW, it’s also possible to add args to JVMs invoked from scripts using JVM_TOOL_OPTIONS.
Great.
Detailed Results And Notes
1.8 plain
 Performance counter stats for '/home/mjg/tools/java/bin/java -cp clojure-1.8.0.jar clojure.main -e (println :hello-1.8)' (50 runs):
       1333.399283      cpu-clock (msec)          #    1.486 CPUs utilized            ( +-  0.72% )
       0.897062153 seconds time elapsed                                          ( +-  1.61% )
1.9 plain
 Performance counter stats for 'clojure -e (println :hello-1.9)' (50 runs):
       1679.680371      cpu-clock (msec)          #    1.573 CPUs utilized            ( +-  0.58% )
       1.067714468 seconds time elapsed                                          ( +-  0.68% )
1.8 + CDS
 Performance counter stats for '/home/mjg/tools/java/bin/java -Xshare:on -cp clojure-1.8.0.jar clojure.main -e (println :hello-1.8)' (50 runs):
       1307.874733      cpu-clock (msec)          #    1.538 CPUs utilized            ( +-  0.51% )
       0.850517711 seconds time elapsed                                          ( +-  0.87% )
1.9 + CDS
 Performance counter stats for 'clojure -J-Xshare:on -e (println :hello-1.9)' (50 runs):
       1622.181099      cpu-clock (msec)          #    1.611 CPUs utilized            ( +-  0.58% )
       1.007119652 seconds time elapsed                                          ( +-  0.62% )
The -J-Xshare:on arg is definitely being passed down correctly to the JVM. You can check by deleting the classes.jsa file and watching it fail.
1.8 + AppCDS
 Performance counter stats for 'java -Xshare:on -XX:+UnlockCommercialFeatures -XX:+UseAppCDS -XX:SharedArchiveFile=appcds.cache -cp clojure-1.8.0.jar clojure.main -e (println :hello-1.8)' (50 runs):
        720.863677      cpu-clock (msec)          #    1.565 CPUs utilized            ( +-  1.02% )
       0.460565030 seconds time elapsed                                          ( +-  1.30% )
1.9 + AppCDS
OK I actually got an error when I tried to create the AppCDS cache for Clojure 1.9:
⇒ java -XX:+UnlockCommercialFeatures \
       -XX:+UseAppCDS \
       -Xshare:dump \
       -XX:SharedClassListFile=appcds-9.classlist \
       -XX:SharedArchiveFile=appcds-9.cache \
       -cp 1.9-scratch/clj-scripts/libexec/clojure-scripts-1.9.0-beta1.229.jar clojure.main -e '(println :hello-clojure)'
Allocated shared space: 50577408 bytes at 0x0000000800000000
Loading classes to share ...
Java HotSpot(TM) 64-Bit Server VM warning:
The shared read write space is not large enough
to preload requested classes. Use -XX:SharedReadWriteSize=<size>
to increase the initial size of shared read write space.
(Edit: Should be fixed in 18.3 - thanks @cl4es for the tip-off).
I need to increase the size of that shared read write space, but to what?! How big is it by default? Using the very helpful flag -XX:+PrintFlagsFinal we see:
size_t SharedReadWriteSize = 10485760 {product} {default}
I assume that’s in bytes, so it’s 10mb by default. Give it 20mb with
-XX:SharedReadWriteSize=20971520
and we’re back on track again. Results:
 Performance counter stats for 'java -Xshare:on -XX:+UnlockCommercialFeatures -XX:+UseAppCDS -XX:SharedArchiveFile=appcds-9.cache -cp 1.9-scratch/clj-scripts/libexec/clojure-scripts-1.9.0-beta1.229.jar clojure.main -e (println :hello-1.9)' (50 runs):
        913.862261      cpu-clock (msec)          #    1.609 CPUs utilized            ( +-  0.85% )
       0.568127480 seconds time elapsed                                          ( +-  1.12% )
1.8 + AOT
 Performance counter stats for 'java -XX:AOTLibrary=./touched_methods.so -cp clojure-1.8.0.jar clojure.main -e (println :hello-1.8)' (50 runs):
        704.220799      cpu-clock (msec)          #    1.020 CPUs utilized            ( +-  0.40% )
       0.690451647 seconds time elapsed                                          ( +-  0.41% )
1.9 + AOT
 Performance counter stats for 'java -XX:AOTLibrary=./touched_methods-9.so -cp 1.9-scratch/clj-scripts/libexec/clojure-scripts-1.9.0-beta1.229.jar clojure.main -e (println :hello-1.9)' (50 runs):
        857.018275      cpu-clock (msec)          #    1.015 CPUs utilized            ( +-  0.31% )
       0.844627327 seconds time elapsed                                          ( +-  0.35% )
1.8 + AppCDS + AOT
 Performance counter stats for 'java -Xshare:on -XX:+UnlockCommercialFeatures -XX:+UseAppCDS -XX:SharedArchiveFile=appcds.cache -XX:AOTLibrary=./touched_methods.so -cp clojure-1.8.0.jar clojure.main -e (println :hello-1.8)' (50 runs):
        377.637749      cpu-clock (msec)          #    1.021 CPUs utilized            ( +-  0.25% )
       0.369733871 seconds time elapsed                                          ( +-  0.27% )
1.9 + AppCDS + AOT
 Performance counter stats for 'java -Xshare:on -XX:+UnlockCommercialFeatures -XX:+UseAppCDS -XX:SharedArchiveFile=appcds-9.cache -XX:AOTLibrary=./touched_methods-9.so -cp 1.9-scratch/clj-scripts/libexec/clojure-scripts-1.9.0-beta1.229.jar clojure.main -e (println :hello-1.9)' (50 runs):
        454.206325      cpu-clock (msec)          #    1.032 CPUs utilized            ( +-  0.41% )
       0.439934846 seconds time elapsed                                          ( +-  0.44% )